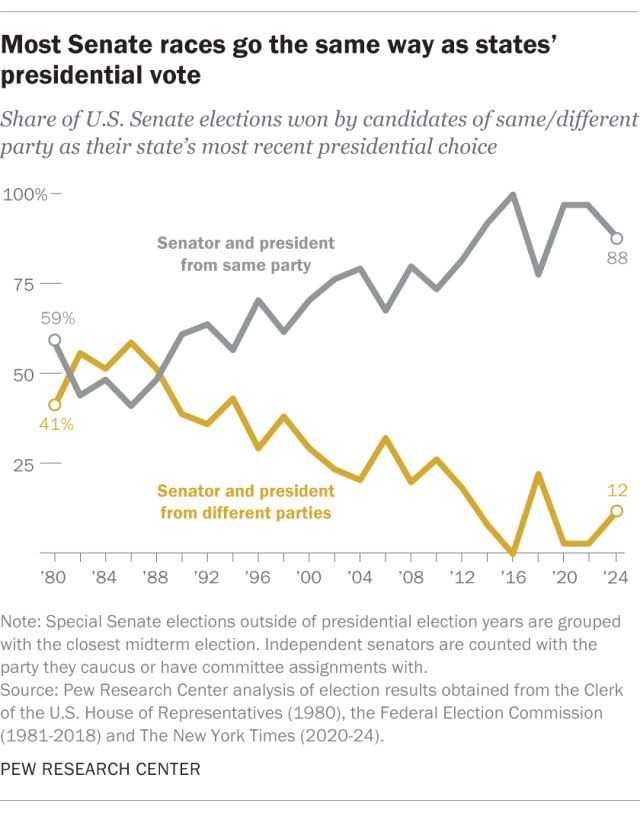
Four states that Republican Donald Trump carried in this month’s presidential election also elected Democratic senators. That may not seem like a lot, but it’s twice as many “mismatches” between states’ presidential and U.S. Senate results as in all Senate elections held in 2020, 2021 and 2022 combined.
Pew Research Center conducted this analysis to explore the alignment between states’ presidential and senatorial votes over time. For past years’ election results, we compared the winning party in each Senate election with the outcome of the most recent presidential election in that state using information from the Federal Election Commission and the U.S. House Clerk’s office. The 2024 results are from The New York Times’ election tracker.
For analytical purposes, special Senate elections were grouped with the closest midterm election. Three senators elected as independents who caucus, or caucused, with Senate Democrats (Bernie Sanders of Vermont, Angus King of Maine and Joseph Lieberman of Connecticut) were counted as Democrats. In addition, Sen. Kyrsten Sinema of Arizona, who left the Democratic Party in December 2022 and registered as an independent, was counted as a Democrat because she retained her committee assignments through the Democratic caucus.
This year, the states that chose Trump for president and sent a Democrat to the Senate were:
- Arizona: Rep. Ruben Gallego won the seat that independent Sen. Kyrsten Sinema is vacating.
- Michigan: Rep. Elissa Slotkin will succeed retiring Sen. Debbie Stabenow.
- Nevada: Incumbent Sen. Jacky Rosen fended off political newcomer Sam Brown.
- Wisconsin: Incumbent Sen. Tammy Baldwin edged out financier Eric Hovde.
No states had mismatches in the other direction, electing Republican senators but picking Democrat Kamala Harris for president.
The four mismatches, out of 34 Senate elections this year, made for a “mismatch rate” of nearly 12%. That’s the highest since the 2017-18 cycle, when the mismatch rate was 22%, according to Pew Research Center’s analysis of results going back to 1980. Along with a Democratic win in the 2017 special Senate election in Alabama, seven out of 35 Senate races in the 2018 midterms (including two special elections) went to a different party than the state’s 2016 presidential vote did.
President-Senate mismatches of this sort used to be fairly common. But since 1990, fewer than half of Senate elections have diverged from their state’s most recent presidential vote – and over the past dozen years, the trend has been for fewer and fewer to do so.
Since 2012, 91% of Senate contests (222 of 245) have been won by candidates from the party that won that state’s most recent presidential race. This includes both regular and special elections. (Independents are counted with the party they caucus with or get their committee assignments from.)
Even as recently as 2006, 30% of Senate contests (10 of 33) were won by candidates whose party didn’t match their state’s most recent presidential pick.
The 2017-18 election cycle departed a bit from the more recent pattern. But even then, there were only eight mismatches out of 36 regular and special Senate elections. As was the case in 2024, all of those mismatches were Democratic victories in states that Trump had carried in the 2016 presidential race.
In earlier years, mismatches between senatorial and presidential elections were more common. In 1980, for instance, Democrats won 39% of the Senate elections held in states that chose Republican Ronald Reagan for president (12 of 31). Two states elected Republican senators despite going for incumbent President Jimmy Carter, the Democrat.
In the 1982 midterms, Democrats won 60% of the Senate contests held in states Reagan had won in 1980 (17 of 28).

The mismatch rate peaked at 59% in 1986. That year, Democrats won back control of the Senate after Reagan’s 1984 landslide reelection, taking 20 of 34 Senate races in states he’d won in 1984.
Since then, however, the mismatch rate has trended lower. In 2012, the same year Democrat Barack Obama carried 26 states in his presidential reelection bid, the mismatch rate was 18%. In the 2013-14 cycle, all but three of the 38 Senate elections mirrored the 2012 presidential vote, for a mismatch rate of 8%. And in 2016, all 34 Senate contests tracked the presidential vote in their states.
One result of this trend is a decrease in split Senate delegations. In the incoming 119th Congress, just three states – Maine, Pennsylvania and Wisconsin – will have senators from different parties. That’s the lowest number of split delegations since direct popular election of senators began in 1914.
The trend also is similar to the decline of split-ticket voting in U.S. House races – that is, voting for a House Democrat and a GOP presidential candidate, or vice versa. That development has contributed to House seats rarely “flipping” from one party to the other, which appears to have continued this year. Although a few races have yet to be called and redrawn district maps have muddied some of the comparisons, as of this writing fewer than a dozen House seats clearly flipped from one party to the other in 2024.
One reason for the declines in split Senate delegations and split-ticket voting in House races is rising antipathy between Democrats and Republicans, on personal characteristics as well as political values.
Note: This is an update to a post originally published June 26, 2018.


