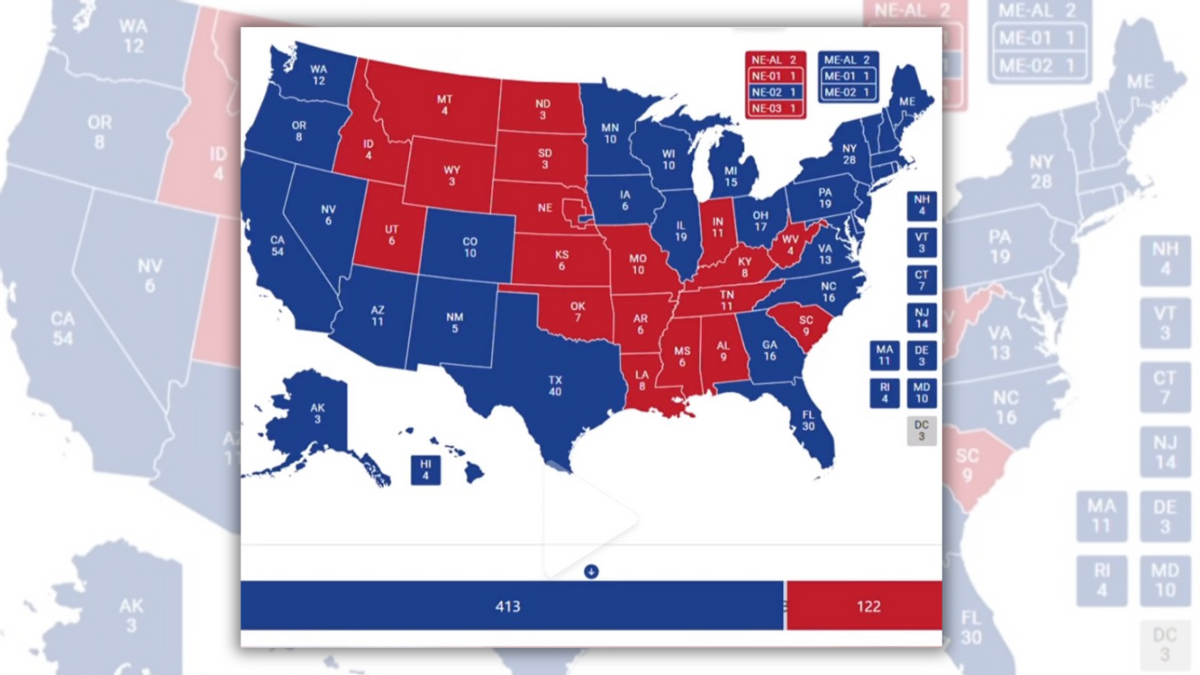
A map circulating on social media in early November 2024 depicted hypothetical 2024 U.S. presidential election results if only women had voted.
The map was created before Election Day 2024 as a prediction of how women might vote.
In early November 2024, a map spread on social media, allegedly depicting the results of the Nov. 5, 2024, U.S. presidential election if only women had voted. The map, which shows most states colored blue, indicates a strong Democratic preference in this scenario. According to the map, Vice President Kamala Harris would have received 413 electoral votes in this scenario, while former President Donald Trump would have gotten 122.
One popular post (archived) with the map, from Nov. 7, garnered more than 23.2 million views, 464,000 likes and 33,000 shares, captioned with, “someone on tiktok looked at the voting demographics, and this is a map of if only women voted.”

(X user @admirephil)
“This what it should’ve looked like for Kamala,” one X user commented, while another wrote, “This is why women weren’t allowed to vote to begin with. Making dumb a** decisions based of emotional impulses.”
The map spread on various social media platforms, including Threads, Facebook and Imgur.
However, the map was created and shared in mid-October 2024, representing election predictions rather than actual results. Therefore, we have rated this claim as miscaptioned.
Origin of the Map
The map was initially posted by the TikTok user @politicalens on Oct. 16, 2024, and had garnered 7.7 million views, 1.1 million likes and 101,000 shares, as of this writing. This means the map was shared well before Election Day on Nov. 5 and the release of election results.
The description attached to the video indicated it was a prediction, not real election results, reading:
If ONLY WOMEN vote in the #2024Election 🗳️ How will YOUR state (likely) vote? We’ll see in November!
The video included a disclaimer informing “sources are listed in my Linktree bio. All data is drawn from the latest available polls, analyzed alongside historical trends, voter registration stats, turnout projections, and current demographic surveys. These predictions are not guaranteed to be 100% accurate and they never will be.”
We have reached out to the original poster of the map and will update this article if we receive a response.
How Women Actually Voted
According to AP VoteCast, Harris held an advantage among female voters nationally, winning 53% compared to Trump’s 46%. However, as of this writing, The Associated Press had not released state-by-state voting data broken down by gender.
Exit poll data from the The Washington Post, shared on Nov. 6, offered additional insight into how men and women voted, both nationally and in key swing states.

(The Washington Post)
According to the exit poll, nationally, 53% of women voted for Harris, compared with 45% for Trump. This pattern was reflected in several swing states, where Harris reportedly received more support from female voters. For example, in Michigan, North Carolina, Nevada, Pennsylvania and Wisconsin, Harris’ support among women ranged from 54% to 55%, while Trump’s ranged from 43% to 45%. However, Arizona showed a nearly even split among female voters, with 49% for Harris and 50% for Trump.
Similar 2016 and 2020 Maps
Similar maps have circulated following previous U.S. presidential elections, particularly in 2016 and 2020, illustrating hypothetical outcomes if only women had voted. In 2016, author and statistician Nate Silver created the first viral map of this type, showing a hypothetical U.S. presidential election outcome if only women voted. He noted that the map was “based on the FiveThirtyEight polls-only forecast,” which predicted that Hillary Clinton would win over Donald Trump in such a scenario.
To create the map, Silver adjusted Clinton’s polling margins by adding 10 points to her performance in each state, based on her polling advantage among women compared to the overall electorate. This approach resulted in a projected landslide for Clinton, with 458 electoral votes to Trump’s 80.
For further reading, we have investigated a map with red and blue coloring allegedly showing individual county results in the 2024 U.S. presidential election.


